
Playing with the tools
This is an extra tutorial that will teach you how to use the cross tabulation tool as well as how to derive new variables from the “Compute” command. We will use the same file again unaltered, so you may as well open it again (or use the same manipulated one you have been using in the whole tutorial, it does not really make much difference).
Suppose that we are interested to know what is the average AGE of people that have CANCER and their INUSRANCE is IKA.
- Go to the Pre-process tab in the menu bar and press the last element that is called “cross-tabulation”
 .
. - In the new window that appears, from the Upper left column select DISEASE. Now the cross tab will include this variable if we press the button.
- From the upper middle column, select INSURANCE.
- Press Create Cross table to see what happens.
- Close the new window and go back to the main cross tab window. Make certain that DISEASE and INSURANCE are still selected in the respective columns.
- Go to the lower middle column that has a list with statistical metrics (such as variance, Mean, Max ect). Select Mean.
- To the lower left column select AGE like the way I did it.
- Press Create Cross table
- Close all the extra windows, including the main cross tab one.
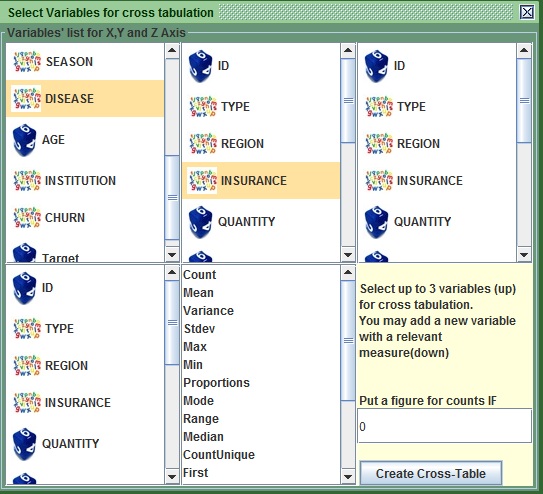
Image:Create a cross-tab of DISEASE versus INSURANCE
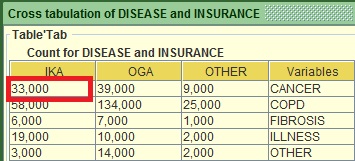
Image:Cross-tab of DISEASE versus INSURANCE
The new window shows the counts of each category group. You can see that the people who have CANER and IKA are 33.
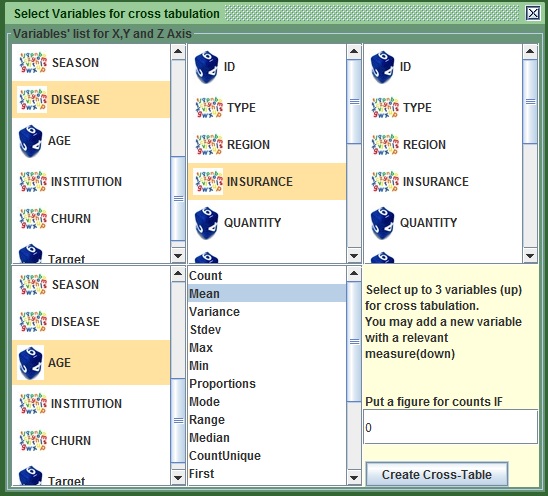
Image:Create a cross-tab of DISEASE , INSURANCE and see the mean of AGE
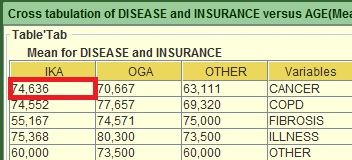
Image:Mean of AGE for all the combinations of DISEASE versus INSURANCE
You can now see the mean of AGE for all the sub groups between DISEASE and insurance.
Let’s try something different know. We want to see how many people come from the OLD INSTITUTION and are more than 75 years old. To do that:
- Go to the Pre-process tab in the menu bar and press the last element that is called “cross-tabulation”.
- In the new window that appears, from the Upper left column select INSTITUTION.
- Go to the lower middle column and Select CountIfhigher.
- To the lower left column select AGE like the way I did it.
- In the lower right section that contains the button, put the value 75.
- Press the Create Cross table button.
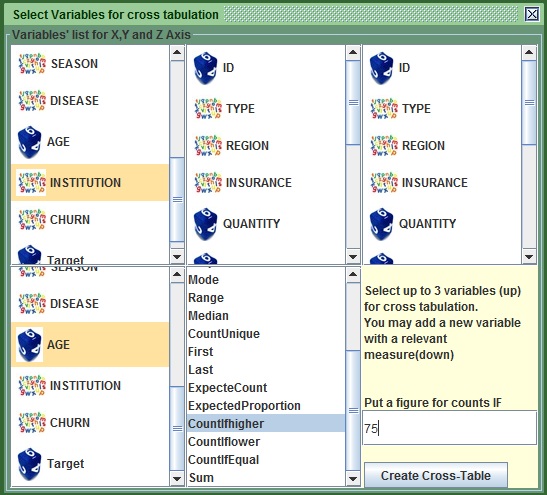
Image:selection for count of people with AGE>75 versus INSTITUTION
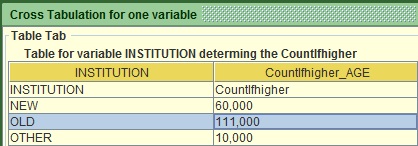
Image:count of people with AGE>75 versus INSTITUTION
There are 111 people that meet our criteria. That is all I wanted to show you regarding the cross table, you can now explore all its functionalities by playing yourself, but first, let me give you a brief explanation about the available statistics:
| Stats | Explanation |
|---|---|
| Count | As it says for any variable |
| Mean | The average for a numeric variable |
| Variance | As it says for a numeric Variable |
| Stdev | The standard deviation of a numeric variable |
| Max | The maximum value of a numeric variable |
| Min | The minimum value of a numeric variable |
| Proportions | The proportions based on the total sample size |
| Mode | The most common value for any variable |
| Range | Maximum minus Minimum for a numeric variable |
| Median | The middle case if we sort a numeric variable |
| CountUnique | Count of distinct values for any variable |
| First | Returns the first encountered value for any variable |
| Last | Returns the last encountered value for any variable |
| ExpecteCount | returns the count based on the proportions for any variable |
| ExpectedProportion | Similarly for any variable |
| CountIfhigher | Count of a numeric variable if the value is higher from the given |
| CountIflower | Count of a numeric variable if the value is lower from the given |
| CountIfEqual | count of a numeric variable if the value is equal to the given |
| Sum | The sum of a numeric variable |
Table :explanation of all statistics available in the cross tab section
Note that sometimes you might need to maximize the frame in order to see all the cross-tabulation by double clicking on the header.
Let us move on a different topic and more specifically in deriving new variables. In modeling sometimes, you use combined variables.
Caution, for this in order to work you need to have the rights to change files in a specific folder.
- Go to the folder where you installed kazAnova Light, Probably in C, Program Files, KazAnova light.
- Inside you will see a folder named “build”. Double click to enter.
- There you will see a folder called “classes”. Do NOT enter. Right click on it and select “properties”.
- Go to the third tab called “security” in Widnows 7.
- Select your User.
- If not all the boxes are ticked, then press “Edit” to change that. See the screenshot below.
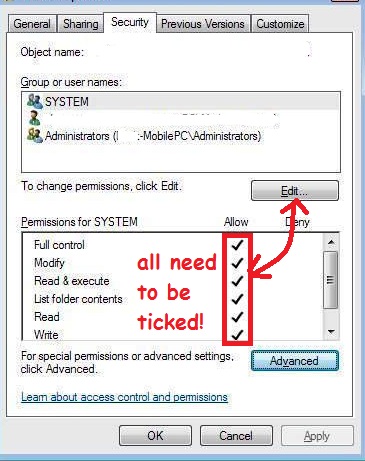
Image :Folder permission screen
If the problem still continues, then try to re-install kazAnova to a folder where you have rights, like you User folder or maybe documents.
Should both these suggestions fail… the derivation functionality will be unaccessible until the next available release when I will try to surpass this issue.
Note that the derivation tools is still in experimental mode and throws messages that have no sense and are completely out of reality. However, even in the current state, it can add value once you understand how it operates.
Assuming you have every right in that folder we can focus on the derivation. For example I want to have one variable that will be the sum of AGE and HOURS.
- Go to the Pre-process tab in the menu bar and press the first element that is called “Compute”
.jpg) .
. - In the first text field on the right, change the value from d0001 to New_Variable.
- Focusing on the table on your left hand side (that is a micrograph of your main table), click in any cell under the column AGE and you will notice that AGE appears in the middle text filed in the right panel, same as I have done it below.
- Go to the middle text field after the word AGE and put the plus symbol + (so now will have AGE + ).
- Go to the left panel and click anywhere under the column HOURS and it will appear after the plus (+) symbol in the middle text field in the right panel. Alternatively, put AGE + HOURS in the middle panel as I have done below.
- Press Compute.
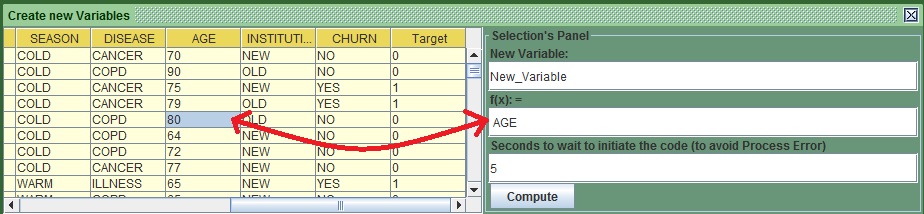
Image :Select AGE from table
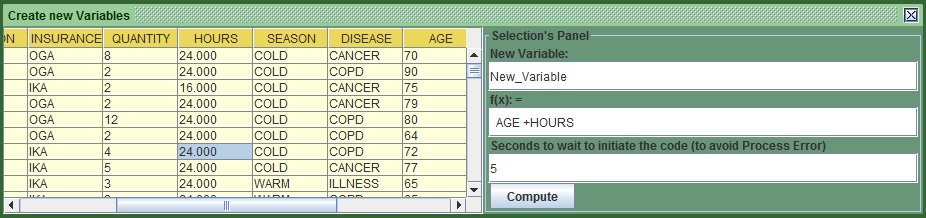
Image :Ready to derive the sum of AGE and HOURS
You will see the new variable sitting at the end of the table to the right, visible belowt:
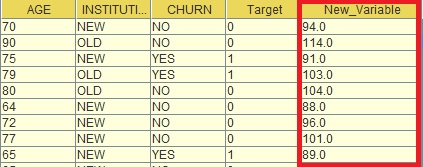
Image :Illustration of the derived variable
If the values are not correct or you have to check again that you have all rights in the folder I mentioned earlier.
The equation you type in the middle field can be longer if you want, E.G. 3+ AGE + 5 + HOURS- QUANTITY. Generally the main operators are:
| Operator | Definition |
|---|---|
| + | Addition |
| - | Subtraction |
| * | Multiplication |
| / | Division |
| % | Division'sremainder |
Table :Available Operators
Generally remember to put 1 space between the different elements to make life of kazAnova easier. Also this Language is case sensitive:
Let’s assume that we want to derive one variable that will take the value of “old” if AGE is higher than 80 else “not old” :
- In the first text field on the right in the copute screen, change the value from d0001 to New_Var_2.
- Copy the following in the middle tab. if AGE > 80 then "old" else "not old".
- Press “Compute”
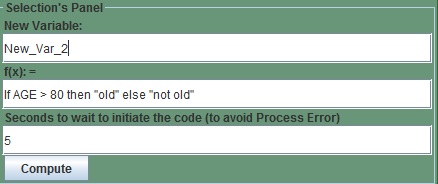
Image :Derive the AGE status
The outcome should look like this:
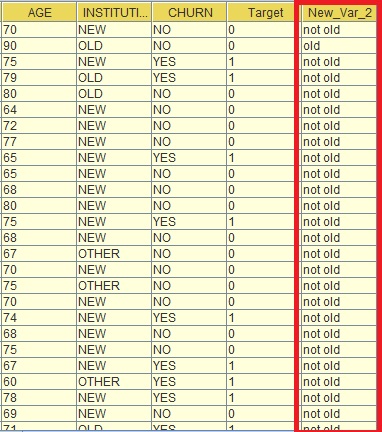
Image :AGE status derived
Now let’s try to make something more complicated. Assume we want to put those that have INSURANCE OGA and AGE is higher than 75 as one group ,those that are IKA or their AGE is higher or equal to 70 as group 2 and everything else in group 3.
- In the first text field on the right, change the value from d0001 to New_Var_3.
- Copy the following in the middle tab. if INSURANCE ="OGA" and AGE >75 then "group1" elseif INSURANCE ="IKA" or AGE>=70 then "group2" else "group3"
- Press “Compute”
It should look like that:
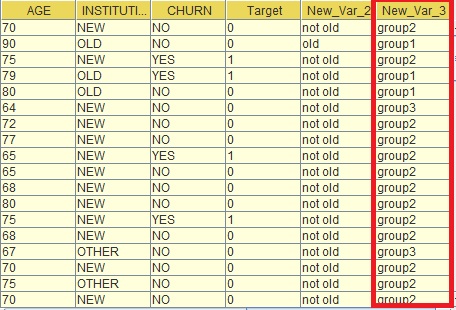
Image :AGE status derived
One last example, Assume that you want a numeric transformation, lets say the natural logarithm of age.
- In the first text field on the right, change the value from d0001 to New_Var_4.
- Copy the following in the middle tab. log(AGE).
- Press “Compute”.
You will notice the new column that is the natural logarithm of AGE. This Language-syntax ( I call it M language) is currently under development, therefore I will not dwell more on it. Later on there will be a more comprehensive tutorial. I have a list of operators and special commands you can use. Generally try to make the commands simple and remember to leave spaces between the operators:
| Logical operators | Definition |
|---|---|
| IF or if | Commands that starts a conditional statement, it requires an else in the same line |
| ELSE or else | Tt follows the if command and the value following it is the default value |
| ELSEIF or elseif | This is used when you want to nest multiple ifs |
| = | Equal: e.g. when something is equal to smething else (num1=num2). |
| <= | Lower or equal (num1<=num2). |
| >= | Higher or equal (num1>=num2). |
| > | Higher (num1>num2). |
| < | Lower (num1<num2). |
| != | Not Equal (num1!=num2). |
| AND or and | Two arguments must occur . E.g. (num1=num2 and num2!=num3) |
| OR and or | At least 1 argument of 2 must occur. E.g. (num1=num2 or num2!=num3) |
| "...text..." | Use these "" to surround text (excluding variables). |
Table :Logical Operators
| Mathematical Commands | Definitions |
|---|---|
| PI() | Mathematical constant, is equal to 3.14 approximately |
| EXP(num) | Euler's number e raised to the power of a number |
| LOG(num) | Returns the natural logarithm of a number |
| LOG10(num) | Returns the logarithm with a base of 10 of a number |
| ABS(num) | Returns the absolute value of a number |
| MIN(num1,num2) | Returns the minimum value of 2 numbers |
| MAX(num1,num2) | Returns the maximum value of 2 numbers |
| POW(num,power) | Returns the first number in the power of the second number (e.g. POW(3,2)=9) |
| SQRT(num) | Returns the square root of a number. |
| SIN(num) | Returns the sine of a number |
| COS(num) | Returns the cosine of a number |
| TAN(num) | Returns the tangement of a number |
| ROUND(num) | General round comand |
| CEIL(num) | Returns the smallest (closest to negative infinity) number |
| FLOOR(num) | Returns the largest (closest to positive infinity)number |
| RAND() | Retruns a random number between 0 and 1 |
| ROWNUM() | Returns the row of the observation |
Table :Mathematical Commands
| String Commands | Definitions |
|---|---|
| TOLOWER(String) | Converts all letter to lowercase |
| TOUPPER(String) | Converts all letters to uppercase |
| ISNUMERIC(something) | Returns 1 if the content is a number else returns 0 |
| EQUALS(String1,String2) | Returns 1 if both Strings are equal |
| NOTEQUAL(String1,String2) | Returns 1 if Strings are not equal |
| LEFT(String,num) | Creates a new String including the first (num) letters of the provided String |
| RIGHT(String,num) | Creates a new String including the last (num) letters of the provided String |
| MID(String,num1,num2) | Creates a substring by taking the letters from num1 to num2 |
| TOREAL(String) | Converts a string to number, if it is impossible, it will return 0 |
| ENDS(String 1, String2) | Returns 1 if String 1 ends with String 2 |
| STARTS(String1,String2) | Returns 1 if String 1 starts with String 2 |
| FIND(String1, String2) | Returns 1 if string 1 can be found in string 2 |
| REPLACEALL(S1,S2,S3) | Replaces all String1 with String2 in String3 |
| REPLACEAFIRST(S1,S2,S3) | Replaces the first String1 encountered in String3 |
Table :String Commands
Generally, use these commands with caution and make certain you cross-validate the results in order to be certain as this is still in experimental mode.
That is the end of tutorial 6, I hope you had a good time going through it and you enjoyed it as much as I did when I was writing it. From now on, you can expect new things to be added in kazA with the new releases. Bear in mind that kazAnova Light is and will remain a free software so you can rely on it to assist you in modeling. Please do send me some feedback from the section contact section or by sending an email to kazanovassoftware@gmail.com to make suggestions, corrections or say just say hi :) .